Building a Better KPI
The Trouble with KPIs
The problem isn’t in using KPIs (Key Performance Indicators) for business performance measurement. The problem is with KPIs themselves. They are often poorly chosen and misused, producing numbers that no one understands or that aren’t very useful. They only tell you how we did, but, not why.
KPIs can cause a great deal of consternation for companies and their teams. Numbers are being asked of people that don’t seem to make much sense. That’s because KPIs often don’t align with overall goals, resulting in KPIs that encourage behaviour inconsistent with what the organization is trying to accomplish. And so KPIs cause frustration.
For KPIs to be valuable they should be actionable numbers that immediately inform how things are progressing and what specific activities need correcting to improve performance. They should require little or no interpretation. When properly set up, they deliver exceptional insight into how the business is performing and what to do to affect change. If the KPI is not being met, you should immediately know what to do differently. That’s because it is only tracking one very specific action or activity. Therefore, Revenue and ROI are not KPIs. More on that later.
We will explore why KPIs so rarely produce the results users expect. But we’ll also detail a proven methodology for identifying and using them which improves business performance and user acceptance. The process will show the logic of selecting KPIs that align with corporate goals and the benefit that delivers.
As part of this discussion, we’ll look at KRIs (Key Results Indicators) and how they differ from KPIs, and why the confusion between the two always creates problems.
Tracking business success is difficult. It’s complex to figure out what to measure, so most companies monitor items that seem important but are not. That may sound ridiculous, but it’s true.
According to Dean R. Spitzer, 93% of organizational leaders believe that measurement is important in influencing business outcomes, but only 51% are satisfied with their current systems, and only 15% are very satisfied. That’s a terrible gap in expectation to reality.

KPIs are overused but underutilized. Companies often spend months trying to establish effective KPIs to improve business performance measurement, but they are often abandoned shortly after implementation because the numbers being tracked are ill conceived and not suitable, so users quickly lose interest. That’s mostly because what’s often called a KPI isn’t a KPI at all.
KPI Definition
A KPI is a measurable value that demonstrates how effectively an individual or organization accomplishes a specific activity or action. Notice we stated it measures specific actions. Not goals. A KPI does not measure goals such as Revenue. More about that a little later still!
As an aggregate, KPIs are used to evaluate progress and performance towards specific objectives, such as revenue growth, customer satisfaction, or operational efficiency. But KPIs are attached to the specific actions that in turn, when considered as a whole, will determine if the overall goal is attained and how your business is doing. KPIs are typically defined and monitored on a regular basis, such as daily, weekly, or monthly, to provide insight into whether an individual or organization is meeting or exceeding its performance targets.
KRI (Key Results Indicators) Definition
KRIs measure the results from your many business actions, whereas KPIs track specific actions or activities. Don’t confuse the two. KPIs don’t measure goals; KRIs do. KRIs will inform how we did but not why. For that, we need KPIs.
Unlike KPIs, which measure the precise actions we take to obtain certain results, KRIs report on results of many activities, are backward looking and inform what has happened. KRIs measure the effect of business activities but ignore the cause. Even though some will suggest that Revenue is a KPI, it is instead a KRI. The acid test is simple; if you can state what you can do differently to change the value, it’s a KPI. When revenue changes, you can’t. That’s because revenue is influenced by many things, such as the closing down of an office, changing the number of sales people, altering the product mix, increasing your selling price, changes in your supply chain and so on. Tracking revenue is of course important, but it’s not a KPI. Product sales, new customers, and even revenue are KRIs and only inform how you did but not why. KPIs will tell you why.
The reason we make the distinction is that many people incorrectly track the results of many actions or activities and call them KPIs. And then forget or neglect to track real KPIs. It’s certainly important to track goals, but you don’t know what caused the goal to be reached or not if you don’t track the actions or activities that align with those goals.
In his book, Key Performance Indicators, David Parmenter states that KPIs have a significant impact on the organization and that they must clearly indicate what action is required by staff. And that’s the part that most KPIs don’t do. Yes, in some cases they may be important KRIs because they tell you how you did. But unfortunately, many KPIs are really KRIs and so don’t measure the precise actions and activities we do to drive performance.
Types of KPIs
KPIs can be grouped in various ways;
- Business discipline
- Quantitative and qualitative
- Outcome and activity-based
Let’s take a closer look at each.
Business discipline
KPIs are used throughout an organization to help track performance and to ensure team members are focusing on activities necessary to driver corporate results. Main areas include:
- Customers:These are KPIs that measure customer satisfaction and loyalty, such as Net Promoter Score (NPS), customer retention rate, and customer lifetime value.
- Operational:These are KPIs that measure operational efficiency, such as cycle time, process efficiency, and defect rates.
- Employees:These are KPIs that measure employee performance and engagement, such as turnover rate, absenteeism rate, and employee satisfaction.
- Marketing:These are KPIs that measure the effectiveness of marketing efforts, such as website traffic, conversion rates, and social media engagement.
- Sales:These are KPIs that measure sales performance, such as sales growth, average deal size, and sales cycle length.
- IT:These are KPIs that measure IT performance, such as system uptime, incident resolution time, and response time.
- Projects:These are KPIs that measure project performance, such as project timeline, budget, and scope.
Many will list financial results as KPIs, but we do not. Tracking financials is obviously important, but we have not included that as a category. The reason for that is that things like Revenue, ROI and cash flow are not KPIs but are instead KRIs. However, if we can attach a specific activity to a financial value, then we can track it as a KPI.
Quantitative and qualitative
KPIs can be quantitative or qualitative in nature. Quantitative KPIs are usually expressed in numerical terms and are measurable, such as website traffic conversions, or the number of leads generated per campaign. They provide a clear and objective way to measure performance and are often used to track progress towards financial or operational goals.
On the other hand, qualitative KPIs are often subjective in nature and are not easily measured, such as customer satisfaction ratings or employee engagement scores. These values are typically measured using surveys, focus groups, or other qualitative research methods. They provide a more nuanced view of performance, and can help organizations identify areas for improvement that may not be captured by quantitative KPIs alone.
Outcome and activity-based
Outcome-based KPIs measure the result or output of a process, while activity-based KPIs measure the inputs or activities that lead to that outcome. The choice between outcome-based and activity-based KPIs depends on the context of the situation and the goals of the organization.
Outcome-based KPIs are suitable when the desired outcome is easily measurable, and the focus is on achieving a specific task. For example, a sales team may use an outcome-based KPI such as the number of units sold to measure their performance. Similarly, a customer service team may use an outcome-based KPI like customer satisfaction ratings to evaluate their effectiveness.
Activity-based KPIs, on the other hand, are useful when the outcome is difficult to measure, or there is a lag time between the activity and the desired outcome. These KPIs measure the inputs or activities that lead to a desired outcome, rather than measuring the outcome itself. In other words, these numbers focus on the effort or work done, rather than the results achieved. For example, a company that is launching a new product may use activity-based KPIs to track the number of product demos conducted, the number of sales calls made, or the number of marketing campaigns launched, instead of just tracking the number of units sold.
While activity-based KPIs may not directly measure the final outcome, they are still useful in providing insight into the progress being made towards achieving the desired result. By measuring the activities that lead to the outcome, teams can identify areas where they need to improve or adjust their strategies to achieve better outcomes in the future.
Ultimately, the choice of which KPIs to use depends on the goals of the organization and the context in which they are working.
Measure and Metric-based KPIs
A KPI can be a measure or a metric. But they are often confused, so let’s define them.
Measure is a number that is derived from taking a measurement. A measure is the observed value of a number at a point in time. Measures are raw numbers and data points found in reports; often in corporate databases, call centers and other data silos. Unless they are evaluated over time, measures deliver little value.
Metric is a calculated number derived or calculated from measures. Ideally, it should be expressed as a ratio, average, percentage or rate.
For example, ‘in-store visitors’ is a measure, while the ‘percentage increase of in-store visitors’ is a metric. Both measures and metrics should be looked at over time, such as daily, weekly, monthly, and so on.
Simply knowing how many visitors we had at a point in time delivers no real insight unless we know how many we had before or how it compares to another measure. The calculation to arrive at the metric does that for us. For example, a measure will tell us we had 1000 visitors to our store one week. But is that good or bad? If we had 800 the week before, then 1000 would be a strong improvement. The measure is 1000, while the metric is “percentage store traffic change week over week” or 25%.
Knowing that you converted 50 visitors to customers on your site this month isn’t on its own helpful. Because it doesn’t compare to anything else. But knowing that you converted 50 visitors to customers out of a total of 500 visitors, tells you that 10% converted. That’s a value we want to track and keep our eyes on. We can then also ask for the conversion rate to be compared to the next period to see if we are improving. That means we could set a KPI to be “conversion rate to customers”, with a Target of 10% or “conversion rate improvement month over month”, with a target of 5% increase. Both are worth tracking.
We have then four values:
- Measure; single data point (should never be used as a KPI)
- Measure over time; single data point over a set time
- Metric; calculation from measures
- Metric over time; calculation from measures over a set time
We can now assign a Target to our KPI so we can measure how we are doing. If we are not attaining our target, we know exactly what to address since it only measures one specific activity or action.
When a value is not expected to change, unless you exert much more effort, it’s fine to track it as a measure if it contains a time constraint. For example, we might assign a target value of 100 to the KPI of “outbound phone calls” to be done weekly. We can then monitor that and see how our team is performing against that target. But we may also want to set targets for growth such as the KPI of “increase in number of client meetings per month”. If we anticipate that it should be increasing, we can look at a percentage increase month over month.
Another item to track could be sales calls. Once again, we need to consider it as a calculation. 50 sales calls is a stale measure, but 50 sales calls per day has real meaning. Our metric might then be to make a certain number of sales calls per day, week or month.
Since there are hundreds or even thousands of measures and metrics produced in our daily corporate lives, KPIs should only focus on the ones that are essential or impactful to business performance. A KPI, as the name implies, measures critical items that are necessary for success. They should monitor actions and events that tell you about performance.
In a formula 1 race, over 1000 data points (telemetry units) are collected every second, but none of them are that you are winning the race. Although we don’t want to assign KPIs to all 1000, some of these are the data points we want to track, because those are the things we can influence and improve. Certainly, we want to win the race, but if we track and improve the things we can directly influence, then positive results will follow.
KPI considerations
Track granular actions and activities rather than aggregate values
Setting personal, departmental or corporate goals is fundamental to most people, but measuring how we perform against them is not enough. Make sure you identify the actions or activities that align to the overall goal. It’s certainly useful to know if Revenue or Profit is changing. But it’s better to figure out why and what’s influencing it. So, drill down to determine what actions or activities are needed to reach your goal. And visualize that.
Select KPIs based on your goals, not what others are doing
Don’t fall into the trap of picking your KPIs because those are the ones used by others or on someone’s top-10 KPI list. KPIs need to be consistent with your particular needs and always driven by your unique business goals. What works for one organization may not work for yours. The factors impacting their performance may or may not apply in your situation. Determine what your activities should be by starting with your organization’s goals and drill down from there.
The logic of decision making
When used correctly, KPIs are an integral part of a strategic business plan. They are determined by stating an organizational goal and working our way down through several layers of increasing detail to figure out what needs to get done. When targets are met, so will the goal.
Show your work – just like in grade school
“A mere 7% of employees today fully understand their company’s business strategies and what’s expected of them in order to help achieve company goals,” according to Harvard professors and co-authors Robert Kaplan and David Norton. By establishing KPIs that align with corporate goals, all team members feel more engaged because they can see how their work affects the bottom line.
Creating KPIs in a logical structured way helps identify what to measure, and it also shows others the roadmap of how you got there. That provides several advantages because it shows:
- how work directly aligns with stated a goal
- progress of critical work
- who is responsible for each activity
- everyone that what they do is important and how their work directly drives corporate goals and objectives
- how much has been accomplished
Be open about your KPIs. Tell the whole company about them. Make results visible for all.
Creating a hierarchical map
Make KPIs more effective by mapping them out. There is, or at least should be, a logical thought process for how those numbers were conceived that creates a hierarchical, decision structure. By showing the logical structure of how performance metrics are conceived, team members understand how they are determined, what activities people are working on, and how their work affects business performance measurement and the overall goals for the company. It’s valuable to see how work aligns with corporate goals and that work assignments make a difference.
Saying that hosting webinars will increase Revenue is a flawed approach and not well thought-out. That’s just guess work and people don’t buy into targets if they are not supported by logic.
Instead, figure it out systematically.
- You might say that your Goal is to increase Revenue by 10%;
- a critical item to accomplish that might be to improve your overall presence in a certain market;
- to do that, you need to engage with a new audience who is unfamiliar to you;
- and the persona or segment to target is engineers in North America;
- for that the approach you may decide on is to show thought leadership;
- an action to accomplish that may be to host webinars regularly;
- you establish a KPI to monitor how many webinars you offer per month and another to track the percentage increases in webinar attendees; and then a third KPI of how that is increasing over time;
- you set a target of hosting 4 webinars per month, and a 20% increase in webinar attendees for each month. (Or you might add a KPI to monitor how engaged your audience is for each webinar are by tracking participation or comments people leave and how that improves over time.)
When mapped out, the logical flow looks like this, with our example highlighted in blue:
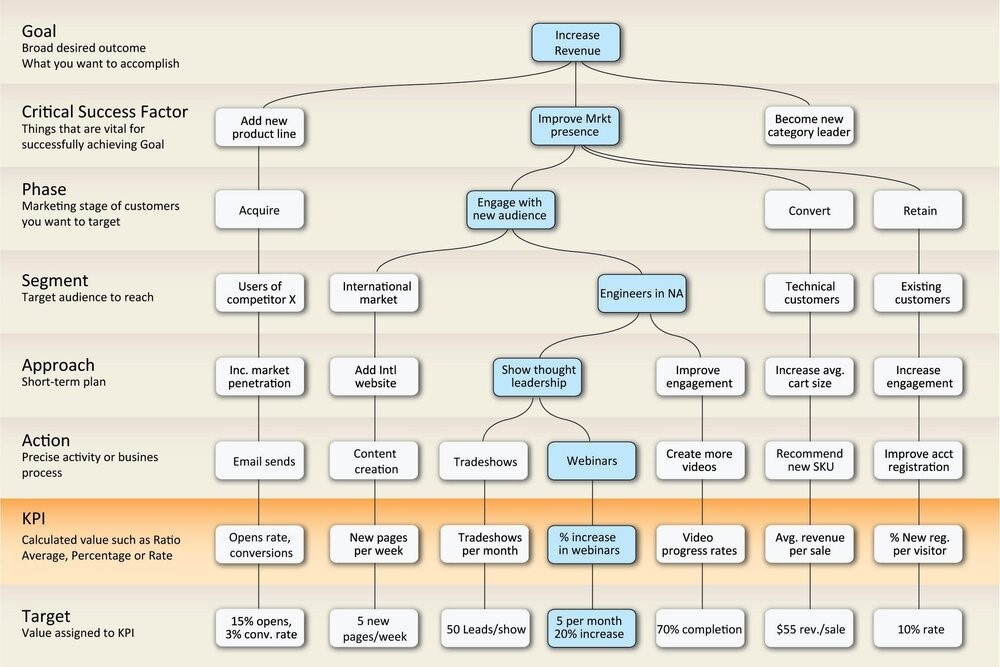
This provides an organized flow of how the decision of increasing webinar interactions was determined. “Increase Revenue” is the goal and the measurement of that is a KRI. But by using this approach we can determine what the actions are to accomplish that result and which KPIs we should monitor.
KPI Karta layers
Building Kartas, which are hierarchical maps to identify important metrics to track is an iterative process of adding layers of increasing detail to describe the decision-making process. If an organization already has KPIs they are following, a Karta can be built to support them. It will help justify why certain activities are important. But whether KPIs are already known or need to be discovered, we always start with the Goal and build the Karta from there.
While goals are critical to measure, we aren’t assigning KPIs to them and therefore, the KPI Karta methodology doesn’t directly track the success or failure of a goal. Instead, the hierarchical map will show the likelihood of reaching the set goal by completing the activities for which we have assigned KPIs.
Goal
A goal for an organization is a specific and measurable objective that the organization intends to achieve within a defined period of time. Goals are often set to help organizations focus their efforts and resources towards a common objective and to measure their progress towards that objective. Goals can be related to a variety of areas such as financial performance, customer satisfaction, employee satisfaction, operational efficiency, market share, innovation, sustainability, and social responsibility. Effective goal-setting involves considering the organization’s mission, vision, values, and strategic priorities, as well as the external and internal factors that may impact the organization’s ability to achieve its goals.
Here are some examples of goals that an organization may set:
- Financial performance – Increase annual revenue by 10% over the next fiscal year.
- Customer satisfaction – Achieve a customer satisfaction rating of 90% on customer surveys within the next quarter.
- Employee satisfaction – Increase employee engagement and satisfaction by implementing a wellness program that leads to a 20% reduction in employee absenteeism.
- Operational efficiency – Improve productivity by reducing waste and optimizing workflows, resulting in a 15% reduction in manufacturing lead time.
- Market share – Expand market share by launching new products that appeal to a wider customer base and capture 5% of the market share in the next 12 months.
- Innovation – Develop and launch a new software product that improves customer experience and generates at least 10% of the organization’s revenue within the next two years.
- Sustainability – Reduce carbon emissions by 20% by implementing renewable energy sources and energy-efficient processes in the organization’s operations.
- Social responsibility – Partner with a local charity to donate a percentage of profits and employee time to support community initiatives and enhance the organization’s social responsibility.
Critical Success Factors
CSFs (Critical Success Factors) are the essential areas of activity that must be performed well if you are to achieve the goals for your business or project. By identifying your CSFs, you can create a common point of reference to help everyone in the team to know exactly what’s most important. And this helps people perform their own work in the right context and so pull together towards the same overall aims.
For example, critical success factors for the goal of increasing revenue might be:
- Customer Service: Providing excellent customer service. Happy customers are more likely to become loyal customers and refer others, which leads to increased sales and revenue.
- Product or service quality: Ensuring that products or services are of high quality and meet the needs of customers can lead to repeat business and positive reviews.
- Competitive pricing: The business should aim to set prices that are competitive with similar products or services in the market while still maintaining profitability.
- Marketing: This includes creating brand awareness, generating leads, and promoting the business through various channels such as social media, email, and advertising.
- Innovation: Regularly introducing new products, services, or features helps businesses stay relevant and attract new customers who are looking for something unique or different.
- Employee Training: Providing regular training to employees is important to ensure they have the necessary skills and knowledge to provide excellent customer service and achieve sales targets. It also helps them stay motivated and engaged, which leads to better performance and increased revenue.
It’s useful to limit the number of CSFs to five or fewer absolute essentials. This helps your CSFs have maximum impact, and so give good direction and prioritization to other elements of your business or project strategy.
To make sure you consider all types of possible CSFs, you can use Rockart’s CSF types as a checklist.
- Industry – these factors result from specific industry characteristics. These are the things that the organization must do to remain competitive.
- Environmental – these factors result from macro-environmental influences on an organization. Things like the business climate, the economy, competitors, and technological advancements are included in this category.
- Strategic – these factors result from the specific competitive strategy chosen by the organization. The way in which the company chooses to position themselves, market themselves, whether they are high volume low cost or low volume high cost producers, etc.
- Temporal – these factors result from the organization’s internal forces. Specific barriers, challenges, directions, and influences will determine these CSFs.
Phase
Many of the Karta examples shown are for sales and marketing organizations. The ‘phase’ in a Karta is related to a sales organization. But the KPI Karta system allows for the creation of layers of any type. Replacing the phase with something relevant to a human resources team, manufacturing plant or shipping company is easy.
For this example, the phase describes the stage of the sales cycle a business is in. Sales activities fall into four distinct phases in the customer lifecycle:
- Acquire – This is the initial broadcast of your marketing message. The attempt is to get your persuasive, introductory message out to as many of your prospective clients and customers as possible.
- Engage – Refine the message by delivering a targeted, meaningful, message to the potential customers that attract them to you for more detailed information.
- Convert – Provide enough incentive, and a simplified process, and cause the potential customer to execute your preferred action.
- Retain – Ensure you delivered value as promised and your product/service has long-term value so they keep coming back.
Segment
Just as with the phase, a segment is specific for a Karta intended for sales and marketing. A segment or customer persona you plan to market to and is a representation of a specific group of customers who share common characteristics, behaviors, and needs. It is a detailed and fictionalized description of an ideal customer that you want to target or serve.
Segmentation is the process of dividing the market into smaller groups based on factors such as demographics, psychographics, geographics, and behavior. Customer personas are developed by analyzing the data collected during the segmentation process and using it to create a detailed picture of the customer group.
Customer personas typically include information such as:
- Demographic characteristics: Age, gender, income, education level, occupation, and marital status.
- Psychographic characteristics: Personality traits, values, attitudes, interests, and lifestyles.
- Behaviors: Purchase history, buying patterns, decision-making process, and preferred communication channels.
- Pain points: Challenges, problems, and frustrations that the customer faces related to the product or service.
- Goals and aspirations: The desired outcome or solution the customer is seeking.
Read Also: Leading and Lagging KPIs
Approach
This broadly describes the short-term items needed to do to meet your critical success factors.
Since not all marketing messages and sales tactics resonate equally with potential customers, you need to tailor your marketing approach, so it is appealing, appropriate, and clear for your various target audiences or market segments. Different market segments may require very different approaches to drive interest and, ultimately, conversion.
Sales and marketing approaches can include:
- Get clients to convert better
- Improve check-out process
- Create Social media campaigns
- Initiate contact with new potential clients
- Participate in trade shows, conferences, and other events
- Developing and executing public relations and media outreach strategies
- Conducting customer surveys to gather feedback and insights
- Implementing search engine optimization (SEO) strategies to improve website visibility
Action and Activities
These are the very specific Actions and Activities required to be performed to support stated Approach. This is the actual work we are going to do or the function we are going to measure and to which we will then attach KPIs to.
Examples can include:
- Make customer phone calls
- Set up new customer meetings
- Launch new Google Ads campaigns
- Optimize Google Ads campaign by adding new key words
- Send mailer
- Greet customers at door
- Completed application form-fills
- Loan applications completed
KPIs
We can monitor the above Actions as measures or metrics. By adding calculations and time elements to measures, we can build effective KPIs and Targets for us to meet.
Build your KPIs by considering the following:
- Sales calls is a measure
- Consider it over time: Sales calls/week -> 100/week
- Make it a Metric: Percent of Sales Calls converted to customers -> 10% converted
- Compare values over time: Month-over-Month -> 5% increase in Sales Calls from one month to the next
Using the Actions from above, we can make the following KPIs:
| Action/Activity | KPI | Target |
|---|---|---|
| Make customer phone calls | Calls per month | 200 |
| Set up new customer meetings | Meetings per week | 4 |
| Launch new Google Ads campaigns | New Ads campaign/quarter | 3 |
| Optimize Google Ads campaign by adding new key words | Updating Ads weekly | 10 |
| Improve new lead conversions by being more responsive | Increase conversion rate Month over Month | 5% |
| Send mailer | Mailers per month | 6 |
| Greet customers at door | Customer greetings per hour | 60 |
| Completed application form-fills | Ratio of completions to visitors | 1:25 |
| Loan applications completed | Percentage completions of those that started | 60% |
The KPI Karta Advantage
KPI Karta is a subscription service that guides organizations to identify, measure and manage metrics and KPIs and to track them against actual performance.
KPI Karta embodies the methodology created at Unilytics (acquired in 2021) for creating effective KPIs by starting with high-level goals and working down through several layers of increasing detail to identify what needs to get done. And it builds a visual map that is colour-coded so users can see how well the team is performing and identify what things need improving. Managers and consultants can show how and why certain business strategies are being recommended.
Recommended Read: Difference Between KPIs and OKRs
Visualization and monitoring
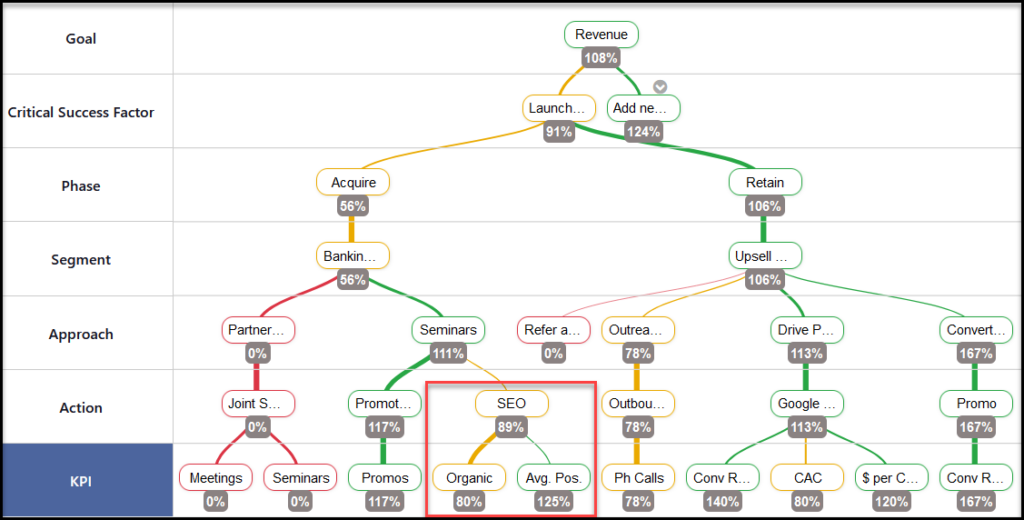
KPI Karta allows users to track their percentage progress against set KPIs and their targets. Targets are monitored weekly, monthly, quarterly or annually. A stoplight (red, yellow, green) model is used to show if targets are hit or missed. The percentage of multiple child-nodes below a parent node will be added up to show the percentage likelihood of attaining each level.
Also, all nodes from branches are not of equal significance. For example, certain Critical Success Factors, Segments and Approaches, as well as KPIs are likely more essential than others. Some activities are more critical. Therefore, users can set weightings on nodes. For example, if three nodes are part of one branch, the user will have the ability to say that one is worth 50% because and the others are worth 25% each. These values will flow up the Karta predicting the likelihood of reaching the set goal.
In the example below, SEO has two KPIs attached to it with the rate of Organic traffic being more heavily weighted than Average Position. Consequently, even though we are performing well on the second KPI, overall, SEO work is underperforming.
Employee commitment
When team members are empowered and involved in determining their targets and performance metrics, they tend to be more engaged, motivated, and productive. Involving team members in the process of setting their goals enables them to take ownership and commit to achieving them.
Additionally, when team members see how their individual targets and KPIs fit into the organization’s broader objectives, they can appreciate the significance of their work and its impact on the whole team. This, in turn, can lead to greater self-management among staff and enable supervisors to focus on other tasks, secure in the knowledge that their team is performing effectively.
Conclusion
KPIs are a great way to drive business decisions and monitor performance. When set up properly, they identify the actions and activities to correct or to improve corporate results. By defining them in a logical hierarchical structure, better KPIs will be created, and individuals tasked with those activities will have stronger buy-in because they will see how their work impacts the organization.