“Our KPIs are a mess!”, said one of our clients. That sentiment resonates with many. Most people will tell you their KPIs (Key Performance Indicators) cause more consternation than gratification. We have also heard frustrated comments such as, “our KPIs aren’t relevant to what we do”, “I don’t know how those KPIs were chosen in the first place”, and “they are just a bunch of numbers to make management look good”. Those are just vanity metrics which appear impressive on the surface but does not provide meaningful insights into the actual performance or success of a business or marketing campaign. (We are using the term KPIs, but we could say performance measures, key figures, indicators, deliverables or just plan metrics. KPIs are simply targets for activities worth tracking.)
Align KPIs with your Goals
KPIs should track specific activities that directly influence how well you are doing against a stated goal. The problem is they often don’t. Instead, activities being tracked don’t align with stated goals and the use of KPIs become maligned.
Choosing the right KPIs for your business can be a challenge. Don’t pick KPIs from a top-10 list or because some other company is using them. They may be appropriate for someone else, but your goals and how you are going to achieve them is unique.
To improve performance in your company, it’s important that you track the activities that are influencing success. According to Gartner, 70% of business transformation efforts fail due to lack of alignment between KPIs and strategic goals. Obviously, you want to track things like Revenue, but if it changes, you don’t necessarily know why. So, we don’t use Revenue as a KPI. Revenue could have been influenced by marketing strategies, sales and channel expansions, market demands and so on. So, instead, you want to track activities and key metrics that affect those things, such as number of proposals and sales calls reps are making; customer conversion rates and the activities you do to influence it; social media posts and their engagement; customer renewal rates and the activities that influence it; customer satisfaction ratings, etc.
A McKinsey study shows that companies aligning their KPIs with business goals are 2.5 times more likely to be among the top performers in their industry. You’ll want to take some time to think about what your business goals are and the strategy of how you are going to get there. That will give you an idea of what specific activities you need to focus on. Still, knowing your goal and strategy doesn’t necessarily make it easy to connect the dots to the things that need to get done. For that, we use the KPI Karta methodology.
Getting buy-in for KPIs
You need to visually show others how the work they do is important because it aligns with the stated Goal. Staff is more engaged and committed when they can see and understand how their work directly affects the success of the business.
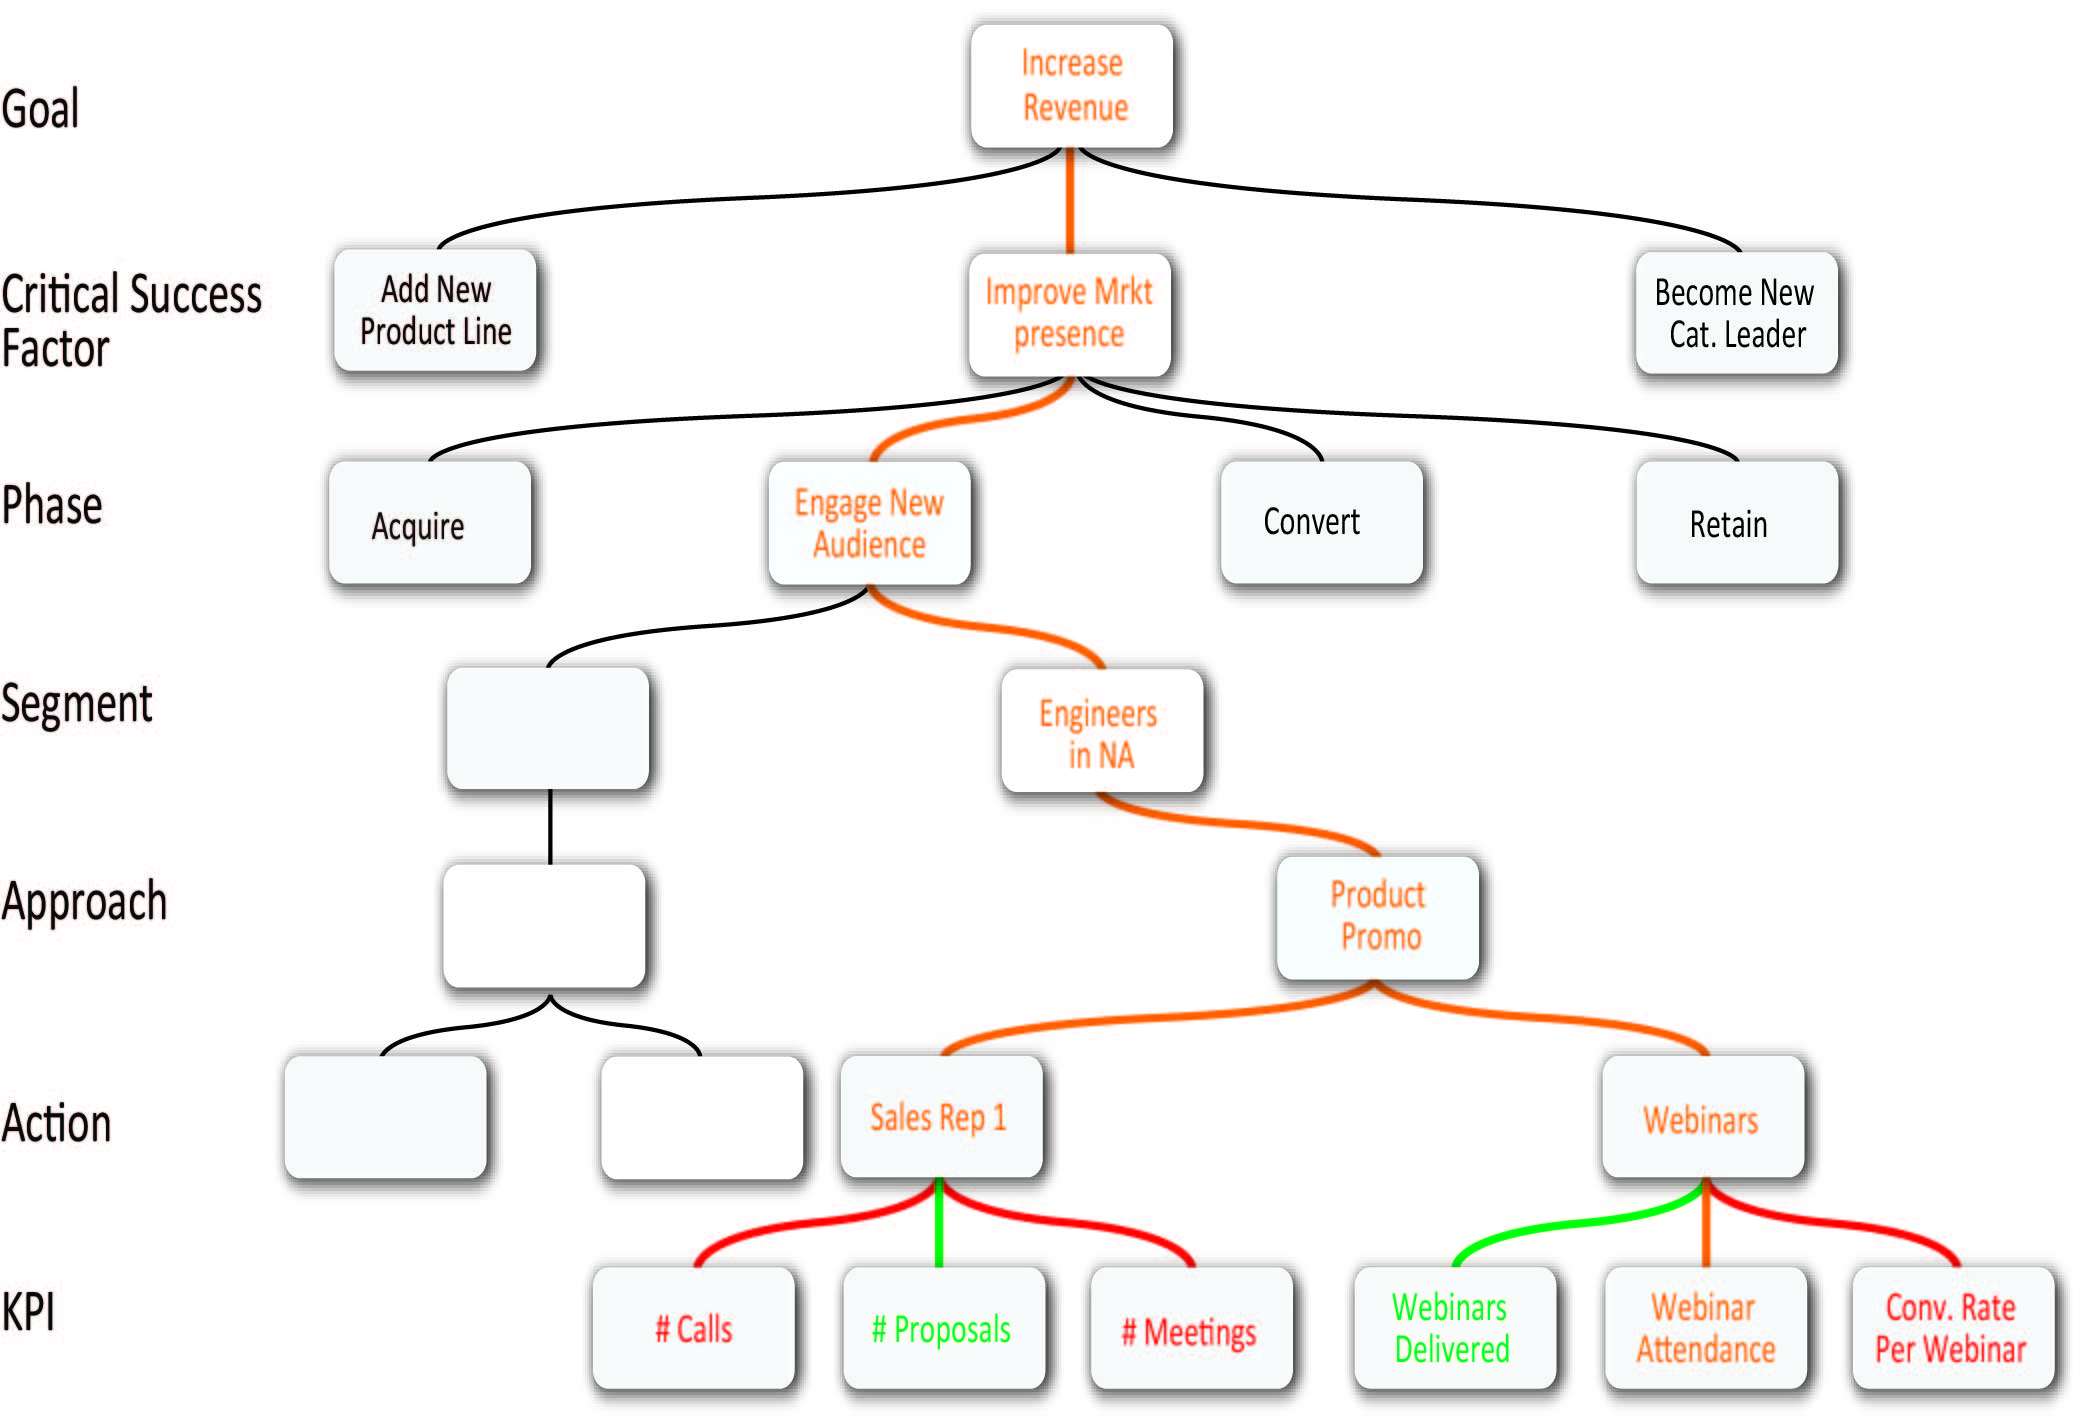
In the image example below,
- Our goal is to Increase Revenue.
- In this example, there are three Critical Success Factors (critically important things we want to do to secure the goal). We have highlighted Improve Market Presence.
- Next, we consider the sales phase we are in with our customers. Are we trying to acquire new leads, engage with existing ones, convert or retain them? Our example says we want to Engage a New Audience.
- We then want to identify who we are selling to; in this case Engineers in NA.
- The Approach we want to take is for more Product Demos.
- The Action will be promoting that through our sales reps and Webinars.
- KPIs for the sales reps are # Calls, # Proposals and # Meetings. For the Webinars, the KPIs are Webinars Delivered, Webinar Attendance and Conversion Rate per Webinar.
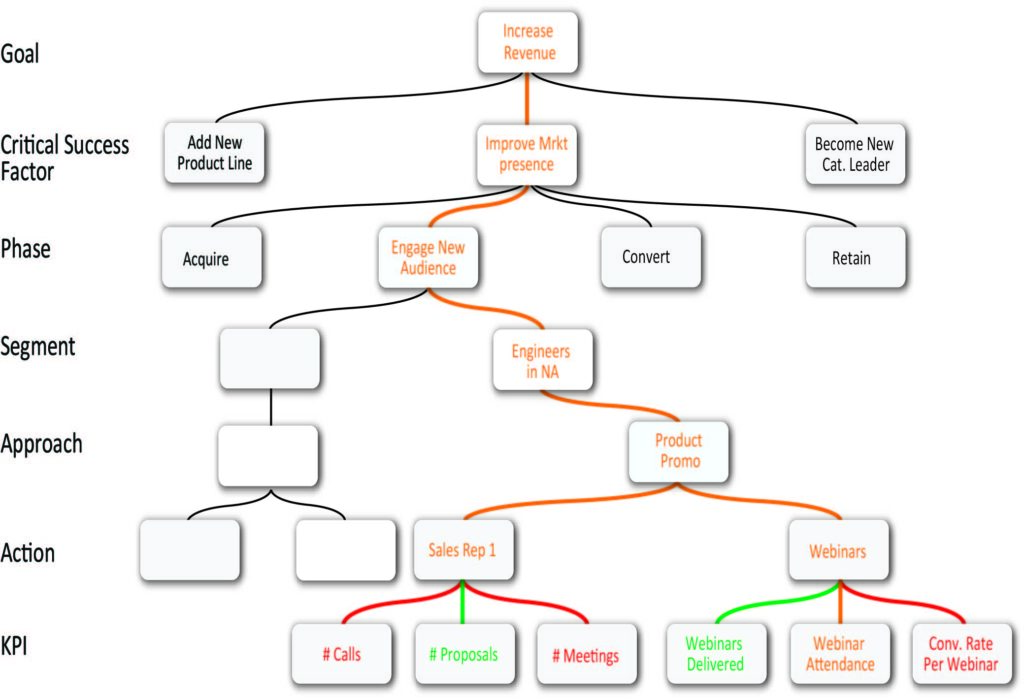
In the diagram, we have shown how color-coding the KPIs can show if we are meeting targets or not. Ultimately, we want to track Revenue and see if we increased it. But it’s the day-to-day activities that influence it and to which we attach KPIs.
Visualize your strategy in a hierarchy
The hierarchical structure helps you visually describe what your strategy looks like to accomplish your goal and it shows a direct alignment of the activities that drive that goal.
Building out a hierarchy like this provides several benefits to users:
- Guides them to identify activities and actions, and related KPIs, necessary to accomplish corporate goals. Users feel more confident in their role because they have a clear roadmap and guidance on how their work ties into the organization’s goals which is motivating and leads to a sense of fulfillment.
- The visual map shows how business goals align with the activities needed to achieve them. They can see that the work they are doing is relevant and important. Users feel less overwhelmed when they can see the bigger picture and how they fit into it. This recognition boosts motivation and job satisfaction.
- Users can track KPIs and targets in real-time, allowing them to see how well they’re progressing toward their goals. Users experience reduced stress because they can quickly identify and address issues or deviations from targets, leading to a sense of calm and proactive management.
Conclusion
People have a love-hate relationship with KPIs. They are often undervalued because they don’t reflect the work that needs to get done. When they directly align with the goal you have set and that connection can be seen, users are much more motivated to accept and use KPIs.